
Africa's Top Product Exports and Destinations
February 2024
Research
Trade
Overview
Africa's international trade landscape presents a dynamic tapestry of opportunities shaped by its rich array of natural resources, agricultural abundance, and burgeoning manufacturing sectors. Over the years, with the support of foreign production knowledge combined with open policies by many local governments in Africa, the increase of GDP per capita in products and services is a strong evidence of all these investments.
Africa has been demonstrating steady growth in export activities, with key mineral commodities such as gold, diamonds, petroleum products and other natural resources. Agricultural staples such as cocoa, coffee, cotton, and tea are also being recognized in the global trade market. The production chains of mineral and agricultural products have long been established with the use of machines and technologies run by the young and energetic workforce.
Besides, the growing emphasis on the export of manufactured goods, particularly textiles, machinery and electronics, is highlighting the continent's efforts to diversify its export bases and ascend the value chain. There is a noticeable increase of labor shifting to work from agricultural to industrial fields, as to meet the increasing demand of urban development, this new labor force is also equipped to take crucial roles in infrastructure and engineering projects.
Growth
Africa's thriving export dynamics reveal a nuanced picture shaped by multiple factors. From increased production efficiency, trade procedures streamline, intra-regional trade agreements, to higher valued-added products propelled by innovation, we are expecting to witness more tight essential strategic partnerships that diversify export categories and destinations.
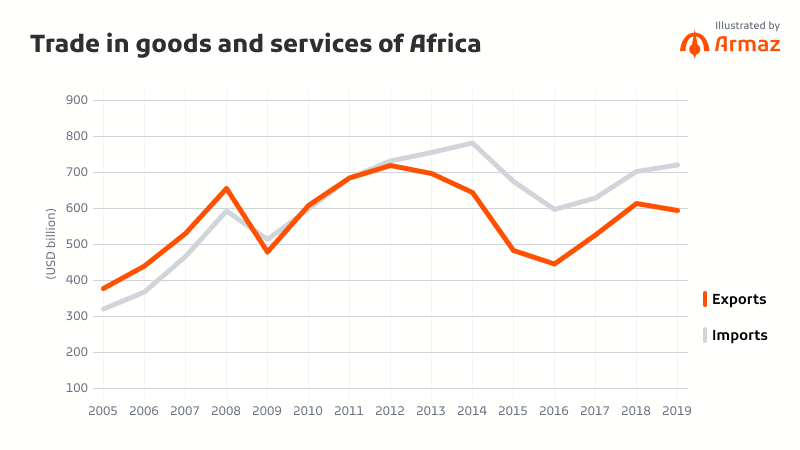
Undeniably, we have experienced an uprising of economic activities in Africa over the past few decades, and the trend will go up along with the youth boom. The value of export goods and services rose 2 times over 15 years from 2005 to 2019. With boosted productivity, the export trade volume of Africa is projected to hit the USD 1 trillion mark by 2035.
African countries have been recovering from COVID-19, and their export activities are rebounding and remaining resilient, with average growth of the overall economy stabilized at around 4 percent annual growth in 2023. The pandemic caused a new world order in which we are starting to see the landscape of African manufacturing led-growth and the integration in the Regional Value Chain. The emergence of more diversified products indicate the potential of export values of Africa in the upcoming years and decades.
Top list
Top product exports, by country in Africa:
Top 1
Top 2
Top 3
🇩🇿 Algeria
40.40%
Petroleum gas
30.20%
Crude petroleum
17.60%
Refined petroleum
🇦🇴 Angola
79.20%
Crude petroleum
9.21%
Petroleum gas
7.92%
Diamonds
🇧🇯 Benin
38.90%
Gold
28.70%
Raw cotton
12.60%
Coconuts, brazil nuts, and cashews
🇧🇼 Botswana
89.60%
Diamonds
1.49%
Insulated wire
1.37%
Copper ore
🇧🇫 Burkina Faso
85.30%
Gold
5.21%
Raw cotton
3.47%
Zinc ore
🇧🇮 Burundi
29.2%
Gold
21.50%
Coffee
14.80%
Tea
🇨🇲 Cameroon
37.90%
Crude petroleum
16.20%
Petroleum gas
11.40%
Cocoa beans
🇨🇻 Cape Verde
42.70%
Processed fish
13.00%
Planes, helicopters, and/or spacecraft
7.98%
Documents of title (bonds etc) and used stamps
🇨🇫 Central African Republic
39.00%
Gold
31.10%
Rough wood
13.40%
Diamonds
🇹🇩 Chad
66.10%
Crude petroleum
27.70%
Gold
4.54%
Other oily seeds
🇰🇲 Comoros
31.00%
Cloves
20.30%
Tug boats
16.90%
Essential oils
🇨🇮 Côte d'Ivoire
30.60%
Cocoa beans
13.90%
Rubber
11.50%
Gold
🇩🇯 Djibouti
51.30%
Palm oil
16.10%
Chlorides
5.08%
Sheep and goats
🇨🇩 Democratic Republic of the Congo
53.60%
Refined copper
26.60%
Cobalt
4.66%
Raw copper
🇪🇬 Egpyt
10.70%
Refined petroleum
8.28%
Crude petroleum
7.85%
Petroleum gas
🇬🇶 Equatorial Guinea
61.70%
Crude petroleum
28.10%
Petroleum gas
7.51%
Acyclic alchols
🇪🇷 Eritrea
39.90%
Zinc ore
31.30%
Copper ore
27.00%
Gold
🇸🇿 Eswatini
24.60%
Scented mixtures
17.00%
Raw sugar
11.20%
Gold
🇪🇹 Ethiopia
26.40%
Coffee
19.50%
Gold
7.65%
Other oily seed
🇬🇦 Gabon
60.70%
Crude petroleum
22.60%
Manganese ore
4.89%
Sawn wood
🇬🇲 Gambia
20.30%
Coconuts, brazil nuts, and cashews
10.60%
Sawn wood
9.87%
Rough wood
🇬🇭 Ghana
37.50%
Gold
25.40%
Crude petroleum
10.70%
Cocoa beans
🇬🇳 Guinea
61.00%
Gold
33.70%
Aluminium ore
0.97%
Aluminium oxide
🇬🇼 Guinea-Bissau
82.10%
Coconuts, brazil nuts, and cashews
11.20%
Petroleum gas
3.23%
Non-fillet frozen fish
🇰🇪 Kenya
16.70%
Tea
10.70%
Cut flowers
3.67%
Coffee
🇱🇸 Lesotho
35.00%
Diamonds
12.00%
Knit women's suits
10.50%
Non-knit men's suits
🇱🇷 Liberia
27.10%
Gold
23.20%
Passenger and cargo ships
23.10%
Iron ore
🇱🇾 Libya
87.60%
Crude petroleum
6.28%
Petroleum gas
1.92%
Refined petroleum
🇲🇬 Madagascar
19.20%
Vanilla
15.30%
Raw nickel
4.53%
Titanium ore
🇲🇼 Malawi
46.10%
Raw tobacco
9.53%
Gold
7.28%
Soybeans
🇲🇱 Mali
96.30%
Gold
0.99%
Raw cotton
0.58%
Other oily seeds
🇲🇷 Mauritania
48.70%
Iron ore
14.60%
Gold
8.43%
Processed crustaceans
🇲🇺 Mauritius
10.70%
Processed fish
8.37%
Raw sugar
4.85%
Non-knit men's suits
🇲🇦 Morocco
12.40%
Cars
12.40%
Mixed mineral or chemical fertilizers
8.54%
Insulated wire
🇲🇿 Mozambique
21.70%
Coal briquettes
17.30%
Raw aluminium
5.58%
Gold
Trade made easy with Armaz Capital ➔
🇳🇦 Namibia
19.50%
Diamonds
12.70%
Radioactive chemicals
11.30%
Raw copper
🇳🇪 Niger
71.40%
Gold
9.11%
Other oily seeds
7.84%
Radioactive chemicals
🇳🇬 Nigeria
72.50%
Crude petroleum
14.80%
Petroleum gas
2.16%
Special purpose ships
🇨🇬 Republic of the Congo
47.20%
Refined copper
25.40%
Crude petroleum
4.72%
Refined petroleum
🇷🇼 Rwanda
23.20%
Gold
6.73%
Refined petroleum
6.25%
Tin ores
🇸🇹 São Tomé and Príncipe
43.20%
Cocoa beans
17.20%
Palm oil
15.30%
Gas turbines
🇸🇳 Senegal
19.20%
Gold
11.80%
Refined petroleum
9.02%
Phosphoric acid
🇸🇨 Seychelles
64.20%
Recreational boats
12.70%
Non-fillet frozen fish
11.50%
Processed fish
🇸🇱 Sierra Leone
24.20%
Titanium ore
18.60%
Iron ore
14.80%
Rough wood
🇸🇴 Somalia
41.70%
Sheep and goats
19.70%
Gold
7.26%
Bovine
🇿🇦 South Africa
17.40%
Platinum
14.00%
Gold
5.35%
Iron ore
🇸🇸 South Sudan
80.80%
Crude peroleum
15.10%
Refined petroleum
1.73%
Forage crops
🇸🇩 Sudan
52.30%
Gold
8.97%
Ground nuts
7.65%
Other oily seeds
🇹🇿 Tanzania
36.70%
Gold
9.53%
Raw copper
3.75%
Dried legumes
🇹🇬 Togo
29.00%
Refined petroleum
17.80%
Gold
7.65%
Asphalt mixtures
🇹🇳 Tunisia
14.00%
Insulated wire
4.00%
Crude peroleum
3.91%
Non-knit men's suits
🇺🇬 Uganda
55.90%
Gold
15.40%
Coffee
2.06%
Cocoa beans
🇿🇲 Zambia
47.30%
Raw copper
22.20%
Refined copper
6.08%
Gold
🇿🇼 Zimbabwe
46.80%
Gold
16.60%
Nickel matters
11.50%
Raw tobacco
Animal and vegetable bi-products
Animal products
Chemical products
Foodstuffs
Machines
Metals
Mineral products
Paper goods
Plastics and rubbers
Precious metals
Textiles
Transportation
Vegetable products
Wood products
World's biggest exporters, from Africa:
World's top exporter
Top destination
Aluminium ore
🇬🇳 Guinea
China
Calcium phosphates
🇲🇦 Morocco
India
Chromium ore
🇿🇦 South Africa
China
Cloves
🇲🇬 Madagascar
India
Cobalt
🇨🇩 DR Congo
China
Cobalt ore
🇨🇩 DR Congo
China
Cocoa beans
🇨🇮 Côte d'Ivoire
Netherlands
Cocoa paste
🇨🇮 Côte d'Ivoire
Netherlands
Cocoa shells
🇳🇬 Nigeria
Netherlands
Copper alloys
🇨🇩 DR Congo
China
Densified wood
🇦🇴 Angola
Vietnam
Glazed ceramics
🇪🇬 Egypt
Libya
Ground nut meal
🇸🇩 Sudan
China
Legumes
🇲🇦 Morocco
Spain
Manganese ore
🇿🇦 South Africa
China
Start Africa trade with Armaz Capital ➔
Phosphoric acid
🇲🇦 Morocco
India
Platinum
🇿🇦 South Africa
United States
Precious metal ore
🇿🇦 South Africa
Germany
Raw copper
🇿🇲 Zambia
Switzerland
Tin ores
🇨🇩 DR Congo
China
Titanium ore
🇿🇦 South Africa
Netherlands
Tungsten ore
🇷🇼 Rwanda
Singapore
Vanilla
🇲🇬 Madagascar
United States
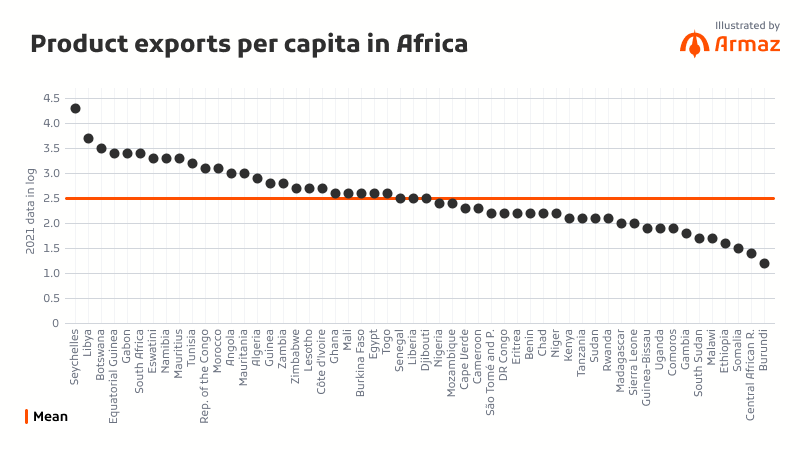
Product exports per capita, by country in Africa:
1
2
3
4
🇸🇨 Seychelles
🇱🇾 Libya
🇧🇼 Botswana
🇬🇶 Equatorial Guinea
$22,100
$4,570
$2,960
$2,760
5
6
7
8
🇬🇦 Gabon
🇿🇦 South Africa
🇸🇿 Eswatini
🇳🇦 Namibia
$2,540
$2,420
$2,100
$1,870
9
10
11
...
🇲🇺 Mauritius
🇹🇳 Tunisia
🇨🇩 Democratic Republic of the Congo
...
$1,780
$1,530
$1,160
...
Top product export destinations, by country in Africa:
Top 1
Top 2
Top 3
🇩🇿 Algeria
20.70%
Italy
14.30%
Spain
13.00%
France
🇦🇴 Angola
58.30%
China
8.28%
India
5.29%
United Arab Emirates
🇧🇯 Benin
39.20%
United Arab Emirates
19.60%
Bangladesh
15.70%
India
🇧🇼 Botswana
United Arab Emirates
21.70%
Belgium
17.00%
India
🇧🇫 Burkina Faso
76.80%
Switzerland
10.70%
India
2.16%
Singapore
🇧🇮 Burundi
31.80%
United Arab Emirates
13.90%
Democratic Republic of the Congo
6.66%
Germany
🇨🇲 Cameroon
28.90%
China
13.60%
Netherlands
8.55%
India
🇨🇻 Cape Verde
63.00%
Spain
8.00%
Angola
7.96%
Portugal
🇨🇫 Central African Republic
34.20%
United Arab Emirates
26.00%
China
14.10%
Italy
🇹🇩 Chad
34.30%
Germany
28.10%
United Arab Emirates
14.80%
Chinese Taipei
🇰🇲 Comoros
21.00%
India
20.80%
Greece
13.40%
France
🇨🇮 Côte d'Ivoire
9.73%
Netherlands
9.62%
United States
7.65%
Vietnam
🇩🇯 Djibouti
53.00%
Ethiopia
15.90%
China
10.50%
India
🇨🇩 Democratic Republic of the Congo
67.80%
China
6.73%
United Arab Emirates
4.92%
South Korea
🇪🇬 Egpyt
8.32%
United States
6.94%
Turkey
6.67%
Greece
🇬🇶 Equatorial Guinea
23.40%
China
16.50%
India
15.70%
Spain
🇪🇷 Eritrea
56.80%
China
27.20%
United Arab Emirates
14.50%
South Korea
🇸🇿 Eswatini
56.00%
South Africa
11.40%
India
5.33%
Kenya
🇪🇹 Ethiopia
23.80%
United Arab Emirates
11.20%
United States
8.18%
Somalia
🇬🇦 Gabon
37.60%
China
14.70%
India
8.75%
South Korea
🇬🇲 Gambia
30.90%
China
27.00%
India
7.73%
Mali
🇬🇭 Ghana
17.40%
Switzerland
12.30%
United Arab Emirates
11.10%
United States
🇬🇳 Guinea
35.90%
India
26.80%
United Arab Emirates
24.90%
China
🇬🇼 Guinea-Bissau
81.30%
India
11.20%
Pakistan
2.52%
Turkey
🇰🇪 Kenya
11.60%
Uganda
8.06%
Netherlands
7.92%
United States
🇱🇸 Lesotho
32.20%
United States
30.40%
South Africa
23.60%
Belgium
🇱🇷 Liberia
21.60%
Switzerland
12.80%
Poland
10.00%
France
🇱🇾 Libya
24.20%
Italty
10.60%
Germany
9.90%
Spain
🇲🇬 Madagascar
18.70%
United States
17.50%
France
11.70%
China
🇲🇼 Malawi
11.10%
Germany
10.10%
United Arab Emirates
9.44%
India
🇲🇱 Mali
78.10%
United Arab Emirates
14.50%
Switzerland
3.55%
Australia
🇲🇷 Mauritania
42.50%
China
9.39%
Spain
8.13%
Canada
🇲🇺 Mauritius
10.60%
France
10.50%
South Africa
8.75%
Zimbabwe
🇲🇦 Morocco
20.30%
Spain
18.80%
France
5.02%
India
🇲🇿 Mozambique
16.70%
India
11.40%
South Africa
10.90%
China
Professional FDI advisory by Armaz Capital ➔
🇳🇦 Namibia
20.90%
South Africa
15.00%
China
12.00%
Belgium
🇳🇪 Niger
70.80%
United Arab Emirates
9.10%
China
5.21%
France
🇳🇬 Nigeria
15.70%
India
11.60%
Spain
6.40%
United States
🇨🇬 Republic of the Congo
26.00%
United Arab Emirates
16.60%
China
7.87%
Greece
🇷🇼 Rwanda
37.00%
Democratic Republic of the Congo
27.60%
United Arab Emirates
4.96%
Thailand
🇸🇹 São Tomé and Príncipe
22.50%
Netherlands
13.40%
Singapore
10.40%
Belgium
🇸🇳 Senegal
22.00%
Mali
14.50%
Switzerland
10.10%
India
🇸🇨 Seychelles
29.40%
Gibraltar
13.70%
Cayman Islands
10.70%
Bermuda
🇸🇱 Sierra Leone
39.00%
China
18.40%
Belgium
8.02%
Germany
🇸🇴 Somalia
37.40%
Oman
28.60%
United Arab Emirates
9.8%
Saudi Arabia
🇿🇦 South Africa
14.40%
China
9.72%
United States
7.22%
Germany
🇸🇸 South Sudan
53.10%
China
15.70%
Italy
15.20%
Singapore
🇸🇩 Sudan
53.30%
United Arab Emirates
14.30%
China
6.27%
Saudi Arabia
🇹🇿 Tanzania
21.70%
India
15.60%
United Arab Emirates
10.80%
South Africa
🇹🇬 Togo
17.90%
United Arab Emirates
16.60%
Angola
10.10%
China
🇹🇳 Tunisia
24.80%
France
17.20%
Italy
13.80%
Germany
🇺🇬 Uganda
56.20%
United Arab Emirates
8.23%
Kenya
5.57%
Italy
🇿🇲 Zambia
35.10%
Switzerland
16.90%
China
10.70%
Singapore
🇿🇼 Zimbabwe
49.20%
United Arab Emirates
25.10%
South Africa
7.15%
China
Africa
Asia
Europe
North America
Oceania
Africa's product and service exports valued USD 1.41 billion in 2021, in which an average of 15 percent of total African exports was estimated to be intra-trade. Leveraging its natural resources, the export value of mineral commodities and precious metals such as gold, diamonds, and petroleum products are significant, compared to other continents.
Service exports from Africa are rather on the low side. In 2021, the continent's service exports accounted for 15.6% of the total African exports of both goods and services, compared to pre-pandemic with 20.8% in 2019. (Armaz Capital is specialized in exports of goods, so the coverage of services is reduced in this writing.)
Opportunities
Based on the expansive population pyramid, investors could quickly realize investing in Africa offers early access to the fastest growing continent with immense potential. By tapping into Africa's export industry, investors can position themselves to capitalize the rising demand for goods and services both domestically and internationally.
Expanding consumer markets:
We will witness the societal shifts of the upcoming generations of youth, with an average of under 19 years old, whose potential is yet to be unleashed with new job creation. More people are undergoing urbanization, and entering the emerging middle class with higher purchasing power and demands for fast-moving consumer goods, electronics, and other products.
Supportive policy environment:
African governments have been actively unlocking partnerships with trading organizations both in the continent and beyond. Initiatives like the African Continental Free Trade Area (AfCFTA) attempts to harmonize trade regulations and facilitate cross-border trade of goods. The COMESA-EAC-SADC tripartite free trade area is also accelerating economic integration across African countries. China's One Belt One Road has activated more ports opened in Africa. Reduction of trade barriers also means more raw and processed goods could be moved freely across the continent with streamlined customs producers, which benefits supply chain operators, investors and business owners.
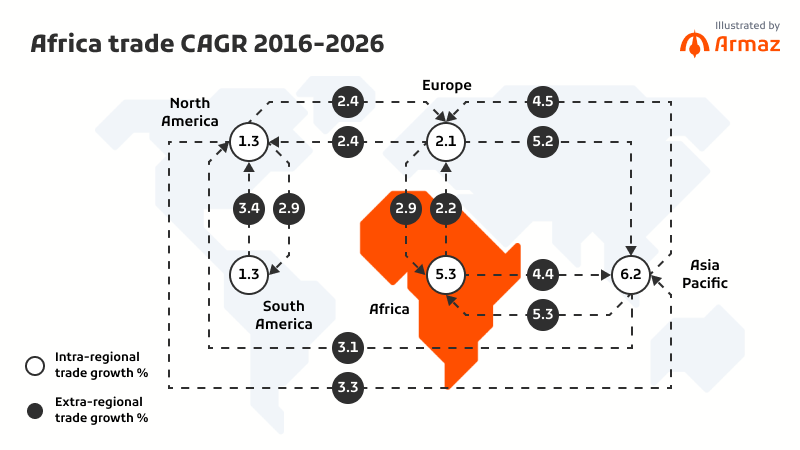
Export to the East:
The vitality of export trade is seen more actively with Eastern countries than the countries in Europe and North Africa. China has injected human capital and industrial facilities for large-scale engineering instructure, which in return has proven to strengthen mutual trade activities. The world's highest population country, India also enjoyed rich import resources from Africa. The United Arab Emirate has gained global attention during COVID-19 thanks to the inflow of wealthy individuals who were convinced by the forward-thinking digital industry policy. The rise of the UAE economy has greatly increased the mobility of various export products from Africa, beyond diamonds, and petroleum byproducts.
Abundant resources:
Due to the abundant arable land, African countries have been investing in agricultural developments, from higher yield farming methods, technology-enable production lines, to various end-product presentations for global consumers. Industrialization efforts also boost the output of manufacturing exports and textiles. The advancement of production facilities has enhanced the exported products not only in the raw form, but also in usable components and semi-finished goods.
Higher export diversification:
Besides more complex manufacturing products such as optical and textiles, Africa has been adding new products to its export baskets. Items such as base metals, footwear, fats and oils, have seen rosen in the past few years. As mentioned, AfCFTA is one key catalyst. The access to cross-country services and intermediate inputs within Africa, attracted foreign investments which were then injected to ignite the export volume of value-added goods to meet external demands.
Despite the optimistic findings, Africa is allocating resources to address complex hurdles such as infrastructural deficiencies, and market volatility. Besides governmental intervention to make the market more free for international trade, the continent required foreign investments to fully harness its export potential.
Sources: WTO, UNCTAD, WITS, ICDT, IFC, ITC, IMF, Word Bank, WEF, OEC, BACI (2021), and many more governments' and NGO materials, etc.
Looking to import & export in Africa?
Meet our specialists to explore allocating investments or starting large-volume good trade in Africa.
Schedule a callHeadquarters: N'Djamena 🇹🇩
HQ address: Boulevard Du President N'Garta Tombalbaye BP:7469 N'Djamena, Chad
Offices: Douala 🇨🇲 | Kigali 🇷🇼 | Mauritius 🇲🇺
+235 64783674
